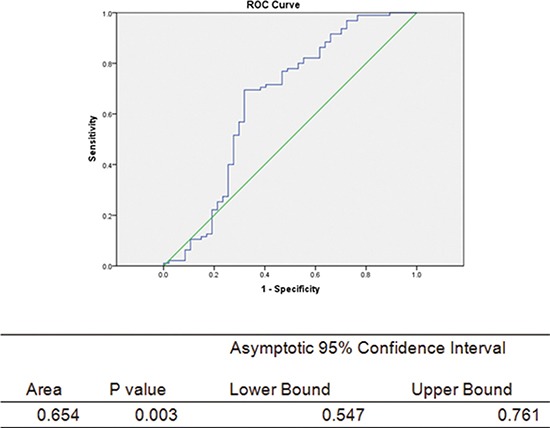
Figure 1. ROC curve for the prediction of PCa by serum oxytocin level.

The green middle straight line is the reference line. Abbreviations: CI = confidence interval, Area under the curve = AUC.

The green middle straight line is the reference line. Abbreviations: CI = confidence interval, Area under the curve = AUC.