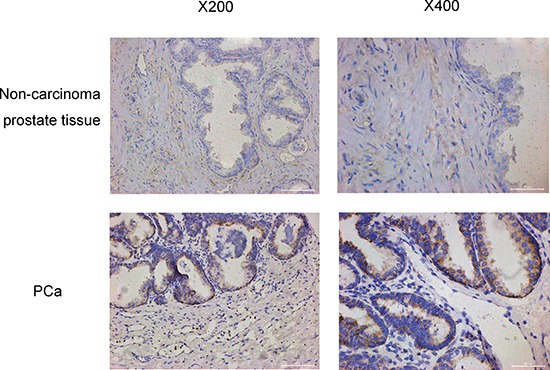
Figure 3. The oxytocin receptor expression in no-carcinoma prostate tissue and the PCa tissue.

The expression is increased significantly in the PCa tissue. The views on the left are magnified 200 times and the views on the right are magnified 400 times.
