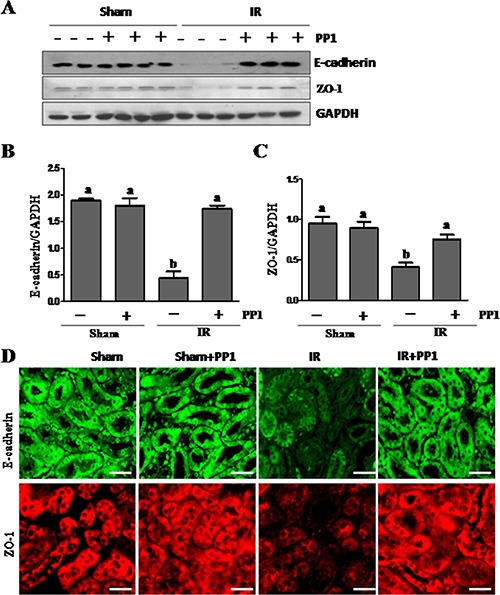
Figure 5. PP1 preserves the expression of E-cadherin and ZO-1 in kidney after renal IRI.

(A) Kidney lysates were subjected to western-blot analysis with specific antibodies against E-cadherin, ZO-1and GAPDH. The expression level of E-cadherin (B) and (C) ZO-1 were calculated by densitometry and normalized with GAPDH. (D) Representative images of immunofluorescence staining for E-cadherin and ZO-1 in kidney sections of sham and renal IRI mice. Scale bar, 50 μm. Data are means ± SEM (n = 6). Means with distinct letter values (A, B) are significantly different from one another (P < 0.05).
