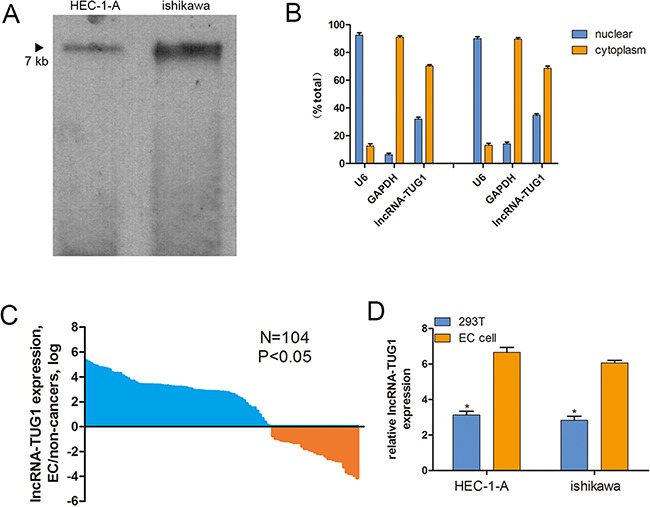
Figure 1. Cellular and molecular characterization of lncRNA-TUG1.

A. Northern blot analysis of lncRNA-TUG1 expression in EC cells. B. The levels of nuclear control transcript (U6), cytoplasmic control transcript (GAPDH mRNA) and lncRNA-TUG1were assessed by qRT-PCR in nuclear and cytoplasmic fractions. Data are mean ± SEM. C. The lncRNA-TUG1 expression was higher in EC tumor tissues than the adjacent tissues, the expression level of lincRNA-uc002kmd.1 was analyzed by qRT-PCR normalized to GAPDH. Data are represented as mean ± SEM. D. LncRNA-TUG1 endogenous expression levels in EC cell lines were determined by quantitative real-time PCR normalized to 293T using GAPDH as an internal control.
