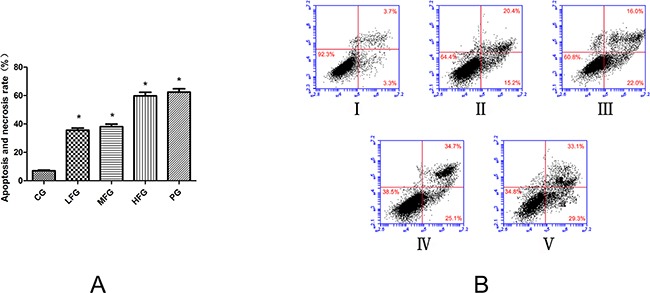
Figure 4. The pro-apoptotic effect of TFS on lung cancer cells (mean+/−SEM, n=3).

Cell apoptosis profiles by Annexin V-FITC/PI double fluorescent assay of A549 cells through flow cytometry. In Figure 5A, it is the histogram of Apoptosis and necrosis rate in each group. They all treated with TFS and Cisplatin in different concentrations for 36 h. In Figure 5B, I represents CG, II represents LFG, III represents MFG, IV represents HFG, V represents PG. *compared with CG, P<0.05 as significant difference.
