
Figure 2. Quantification of DUS4L-BCAP29 expression in gastric and prostate tissues and cell lines.
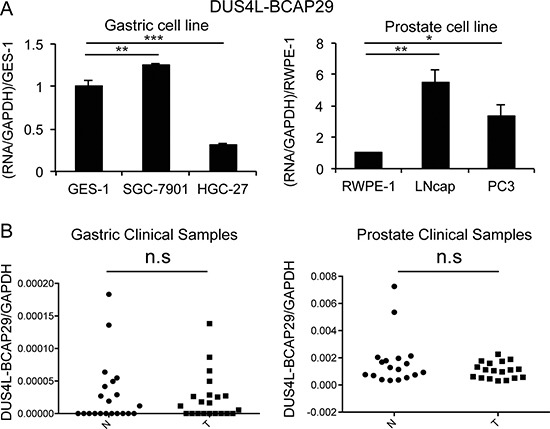
(A) qRT-PCR measuring DUS4L-BCAP29 expression in cell lines. Left panel is the comparison in gastric cell lines, GES-1 and SGC-7901, HGC-27 cell lines. The expression was normalized to GAPDH, and then normalized to that in GES-1. Right panel is the comparison in prostate cell lines, RWPE-1, LNCaP, and, PC3 cell lines. The expression level was normalized to GAPDH, and then normalized to that in RWPE-1. (B) qRT-PCR measuring DUS4L-BCAP29 expression in clinical samples. Left panel is the comparison in 21 gastric cancer and matched normals. Right panel is the comparison in 18 prostate cancer and 18 non-cancer prostate tissue samples. The expression level was normalized to GAPDH.