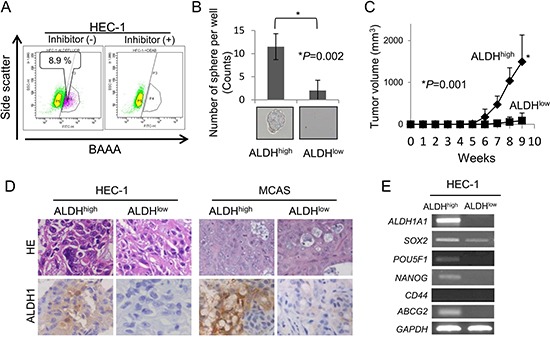
Figure 1. Isolation of CSCs/CICs from HEC-1 cells by Aldefluor assay.

(A) Detection of ALDH1high cells. ALDH1high cells were isolated using HEC-1 cell. Percentage represents the proportion of ALDH1high cells. (B) Representative picture of tumor sphere. ALDH1high and ALDH1low cells derived from HEC-1 cells were cultured in CSC Certified™ Complete Serum-Free Medium. After 2 weeks of culture in vitro, a picture of a tumor sphere was taken and sphere numbers were counted. Data represent means ± SD. (C) Tumor formation ability of HEC-1 ALDH1high and ALDH1low cells. ALDH1high and ALDH1low cells derived from HEC-1 cells were inoculated into the backs of NOD/SCID mice subcutaneously with serial dilution (102 - 104). Graphs show the tumor growth curves of ALDH1high and ALDH1low injected groups with injections of 104 cells. Data represent means ± SD. Differences between ALDH1high cells and ALDH1low cells were examined for statistical significance using Student's t-test. *P value. (D) Histology of ALDH1high cell-derived and and ALDH1low cell-derived tumors. Tumors derived from ALDH1high and ALDH1low cells in HEC-1 and MCAS cells were stained by hematoxylin and eosin and immunostained by ALDH1 antibody. Magnification ×200. (E) Expressions of stem cell markers by RT-PCR analysis. ALDH1high and ALDH1low cells derived from HEC-1 cells were examined for expression of stem cell markers (SOX2, POU5F1, NANOG, CD44 and ABCG2). GAPDH was used as an internal control.
