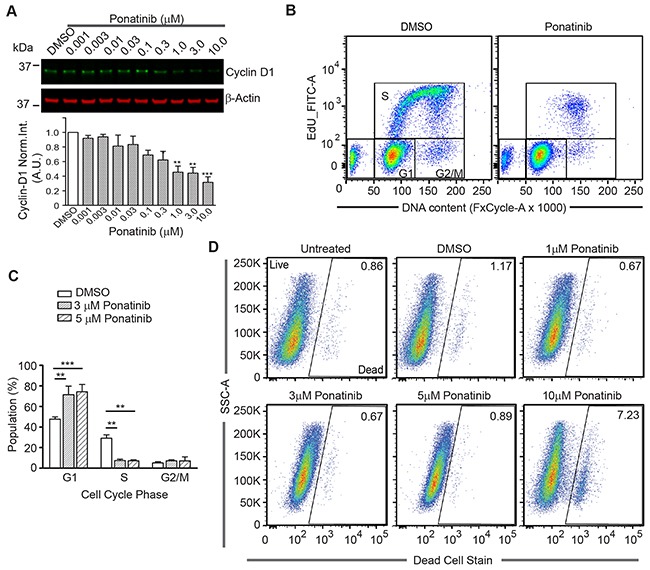
Figure 5. Ponatinib arrests merlin-deficient HSC at the G1 phase of the cell cycle.

(A) Representative Western blots for Cyclin D1of lysates prepared from merlin-deficient HSC#45 treated 24h with increasing concentrations of ponatinib. Plotted below as mean ± SEM (n=3). One-way analysis of variance and Dunnett's multiple comparison post-test were used for statistical analysis (** p<0.01 and *** p<0.001). (B,C) Merlin-deficient HSC were treated with 3 and 5μM ponatinib for 24h and during the last 3h, 10μM EdU was added. Cells were harvested, labeled with live/dead fixable dye, and analyzed by flow cytometry. (B) Representative plots of the distribution of EdU- and FxCycle-labelled cells of 0.1% DMSO vehicle control and ponatinib treated cells. (C) Graph of the distribution of the cell cycle phases (gated for the live population) of all the experiments as mean ± SEM, n=4; **p<0.01 and ***p<0.001 were determined by two-way ANOVA and Bonferroni multiple comparisons post-test. (D) Representative plots of the distribution of live and dead cell population in these experiments with increasing concentrations of ponatinib as indicated.
