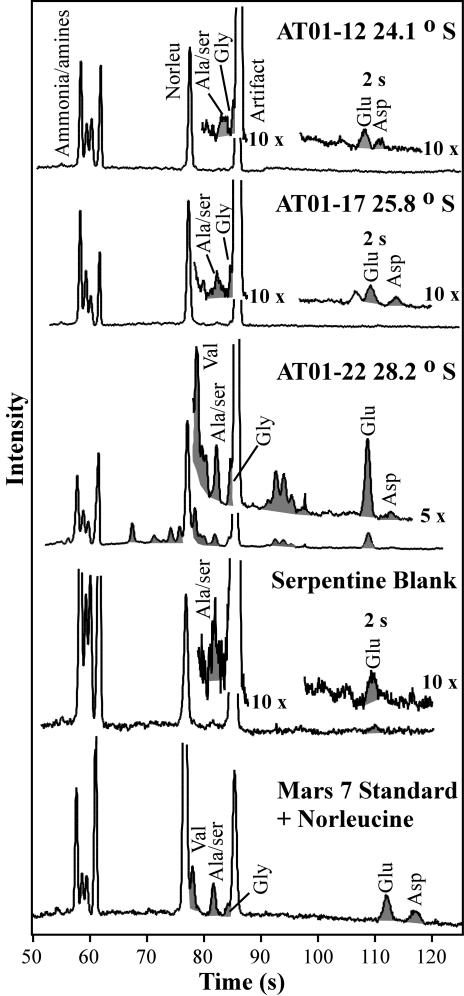
Fig. 5.
Amino acid analysis of aqueous extracts of Atacama Desert soil samples performed by the MOA. The samples are arranged by latitude, with the top sample being the most northern site in the Atacama Desert. All traces have been scaled to identical norleucine internal standard intensity. Full traces are generated by using the cross-injection procedure; indicated expansions of the acidic regions are from the 2-s direct injection, whereas all other expansions are from the 10-s cross-injections.

