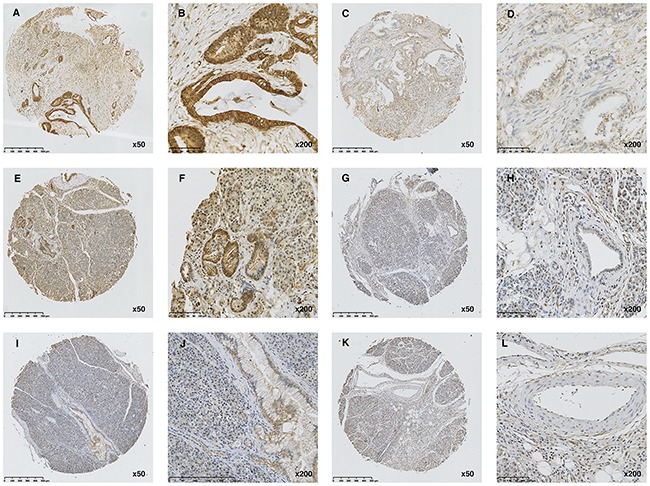
Figure 1. Expression of AHNAK2 in tissue samples.

(A-B) High expression of AHNAK2 in PDAC tissue. (C-D) Low expression of AHNAK2 in PDAC tissue. (E-F) High expression of AHNAK2 in adjacent normal tissues. (G-H) Low expression of AHNAK2 in adjacent normal tissues. (I-J) High expression of AHNAK2 in CP tissue. (K-L) Low expression of AHNAK2 in CP tissue.
