
Figure 1. Biome analysis of human colorectal cancer samples.
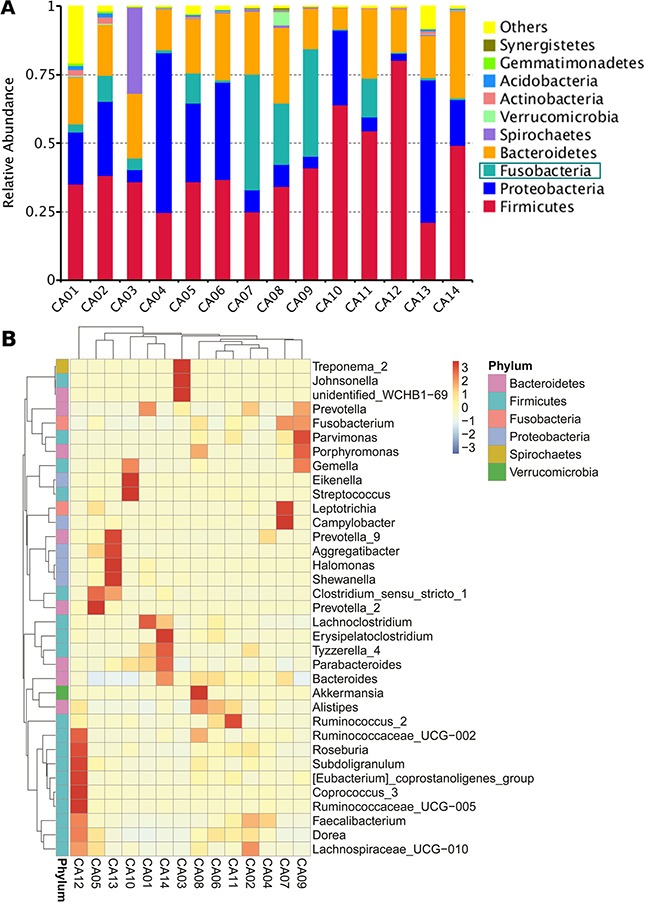
(A) Relative abundance of phyla present in colorectal cancer samples (n = 14). Data shown represent the most abundant phyla, whereas low abundant and unclassified OTUs are grouped as “Others.” (B) Hierarchically clustered heat map analysis of the highly represented bacterial taxa (genus level) in 14 colorectal cancer samples. The relative percentages of the bacterial families are indicated by varying color intensities.