
Figure 3. Fn activates the β-catenin signaling pathway in SW480 cells through the TLR4/P-PAK1/P-β-catenin S675 cascade.
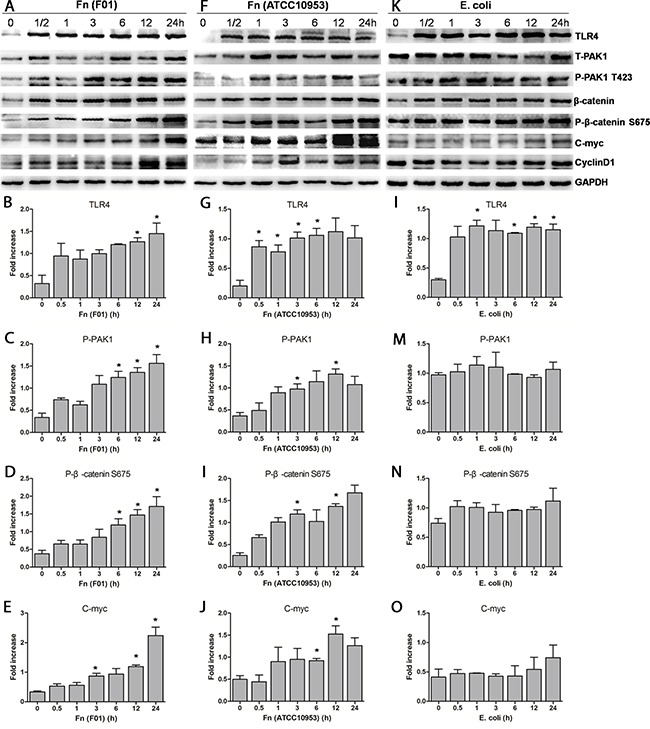
(A-E) Western blots showing that the levels of TLR4, P-PAK1, P-β-catenin S675 and C-myc gradually increase when SW480 cells are challenged with Fn (F01) over increasing time periods. (F-J) The levels of TLR4, P-PAK1, P-β-catenin S675 and C-myc also gradually increase when SW480 cells are challenged with Fn (ATCC10953) over increasing time periods. (K-O) The levels of P-PAK1, P-β-catenin S675 and C-myc do not significantly increase when SW480 cells are challenged with E. coli for increasing time periods, although TLR4 protein significantly increases. T-PAK1, total PAK1; P-PAK1, phosphorylated PAK1. Bar diagrams represent the results obtained after densitometric scanning from three different experiments. Bars represent the mean ± SD. *, P< 0.05, compared with control group (0 h).