
Figure 3. Niclosamide directly interacts with GSK3, inhibiting Axin binding.
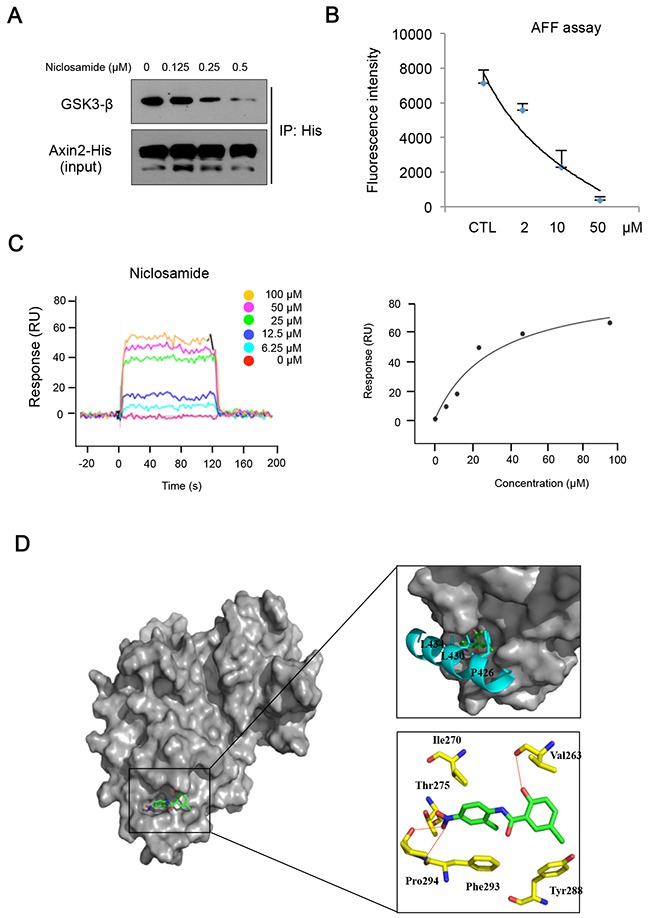
(A) The 293 cells were transfected with His-tagged Axin2 expression vector and treated with increasing doses of niclosamide for an 8 h period. The GSK3 binding activities in lysate were determined by Ni-NTA bead immunoprecipitation followed by immunoblot analysis for GSK3. (B) Recombinant His-tagged GSK3 was subjected to immunoprecipitation to determine FITC-conjugated Axin peptide (19 mer) binding. Remaining fluorescent intensities following incubation with different doses of niclosamide are presented from triplicate experiments. (C) Surface plasmon resonance (SPR) sensograms showing the interaction of niclosamide with immobilized GSK3 (left panel). Five different niclosamide concentrations were analyzed (0 - 100μM). Response units at equilibrium are plotted against the concentration of niclosamide (right panel). The data were analyzed using the ProteOn Manager Software 2.0. (D) Predicted binding mode of niclosamide on the Axin-binding site of GSK3 shown as surface model (left panel). Superimposition of the Axin peptide and niclosamide to demonstrate their similar binding modes within the peptide binding site of GSK3 (top right panel). Detailed interactions between niclosamide and GSK3 are shown as stick model H-bonds are indicated by red dashed lines (bottom right panel). GSK3, Axin peptide, and niclosamide are colored in yellow, cyan, and green, respectively. Figures were drawn using PyMol (Delano Scientific LLC, San Carlos, CA).