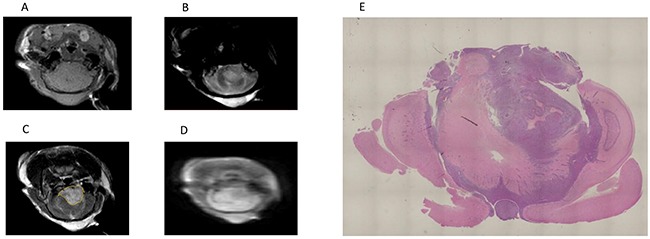
Figure 1. MR images of one representative brain tumor.

(A) T1-weighted MR image. (B) T2-weighted MR image. (C) Gadolinium-enhanced T1-weighted MR image. The yellow line indicates the tumor. (D) IR-TSE image. (E) A histological section of a whole brain referred to the MRI plane, where the ROIs were placed.
