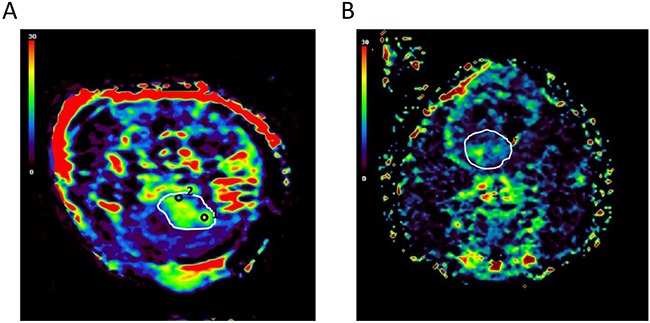
Figure 2. Regional heterogeneity within brain tumors.

(A) PSIC maps obtained for one representative brain tumor show a small proportion of tumor area exhibiting low PSIC (PSIC < 10%). The white line indicates the tumor. Black circles indicate the tumor-ROIs; circle “1” indicates the ROI-h, and circle “2” indicates the ROI-l. (B) PSIC maps obtained for one representative brain tumor with a large proportion of area exhibiting low PSIC (PSIC < 10%). The white line indicates the tumor.
