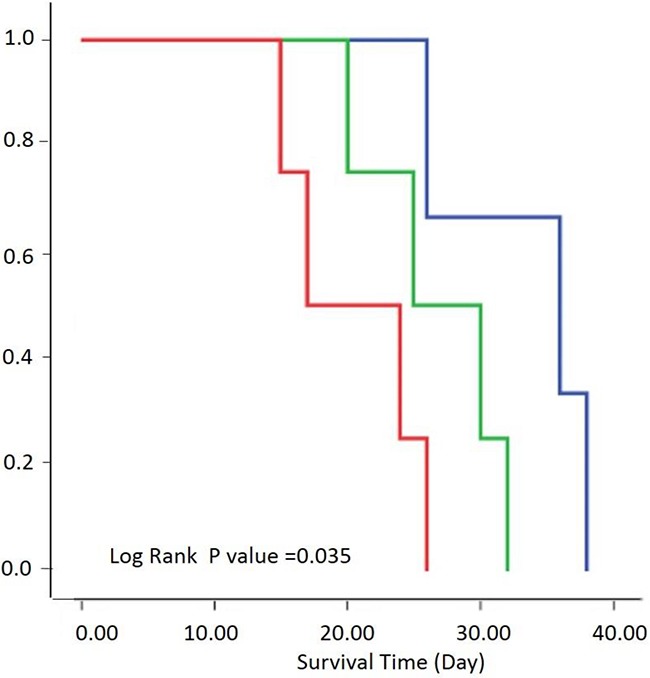
Figure 6. Relationship between survival and PSIC.

Survival by three groups was performed according to the percentage of area exhibiting low PSIC (PSIC<10%). Kaplan-Meier survival curves of rats with a low percentage (<20%; blue), medium percentage (20–30%; green), or high percentage (>30%; red) of tumor area with low PSIC.
