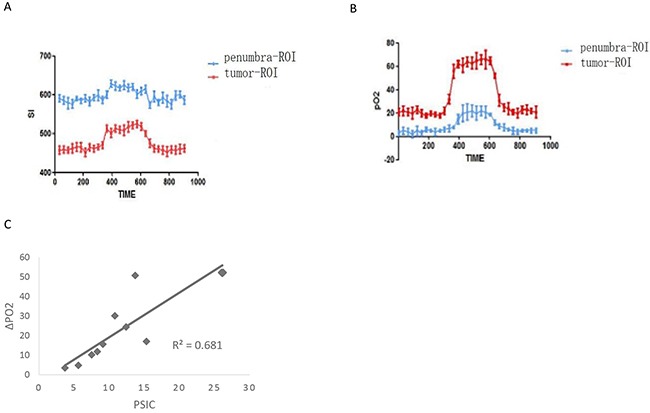
Figure 8. Relationship between PSCI and pO2 measurements in subcutaneous tumors.

(A) Time-SI curves for the tumor-ROI and penumbra-ROI of one representative subcutaneous tumor. (B) The pO2-time curves for the tumor-ROI and penumbra-ROI of one representative subcutaneous tumor. (C) Correlation between PSC and ΔpO2 (crosses) in subcutaneous tumors.
