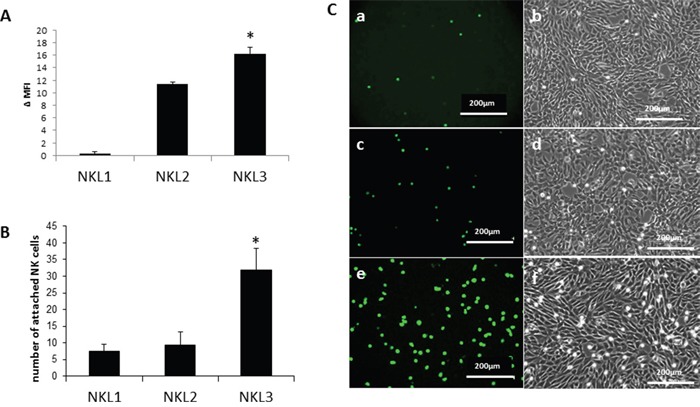
Figure 1. Adhesion of NK cell lines on endothelial cells from peripheral lymph nodes (HPLNEC.B3 cells).

A. Expression of the CCL21 receptor (CCR7) on NKL1, NKL2 and NKL3 cells surface. Results represent Δ MFI (mean fluorescence intensity) from flow cytometry analysis. Values marked with a star vary significantly (p<0.05, N=5) from the NKL1 level of expression. B. Quantification of adhered NK cells counted from ten representative fields. Values marked with a star vary significantly (p<0.05, N=3) from NKL1 and NKL2 adhesion levels. C. Flow adhesion data of NKL cell lines on HPLNEC.B3 cells NKL1 (a, b); NKL2 (c, d); (e, f).
