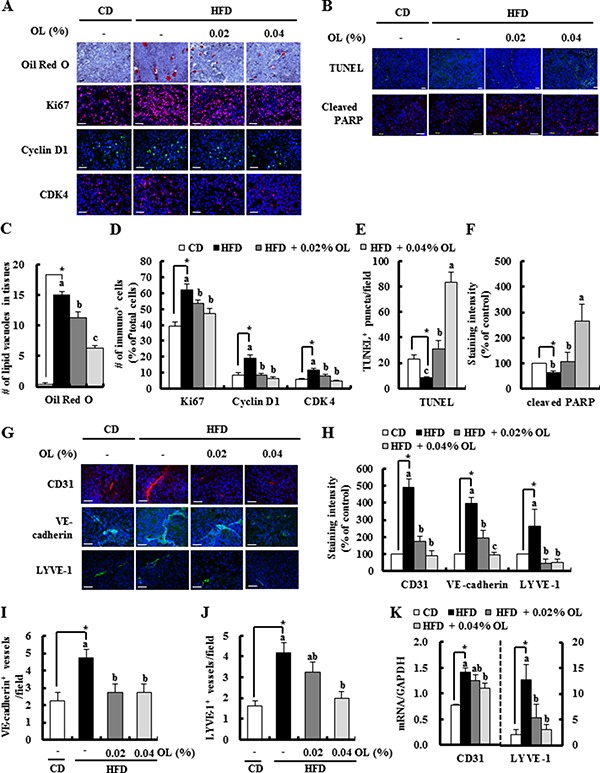
Figure 2. OL suppresses HFD-stimulated accumulation of lipid droplets, cell proliferation, angiogenesis, and lymphangiogenesis and HFD-induced decreases in apoptosis in B16F10 solid tumors.

Tumor sections were stained with Oil Red O and hematoxylin, indicated antibodies or TUNEL. (A, B, G) Representative Oil Red O-stained and immunofluorescence images are shown. (C) The lipid vacuoles were counted. Each bar represents the mean ± SEM (n = 5). (D) Ki67, Cyclin D1, and CDK4-positive cells, (E) The numbers of TUNEL-positive puncta, (F) staining intensity of cleaved PARP, and (H) staining intensity of CD31, VE-cadherin, and LYVE-1 were quantified. (I) VE-cadherin- and (J) LYVE-1-positive microvessels were quantified. Each bar represents the mean ± SEM (n = 5–9). (K) The levels of CD31 and LYVE-1 gene expression in tumors, as determined by real-time RT-PCR (mean ± SEM, n = 8–10). *Significantly different from the CD group, P < 0.05. Means without a common letter differ among the three HFD groups, P < 0.05.
