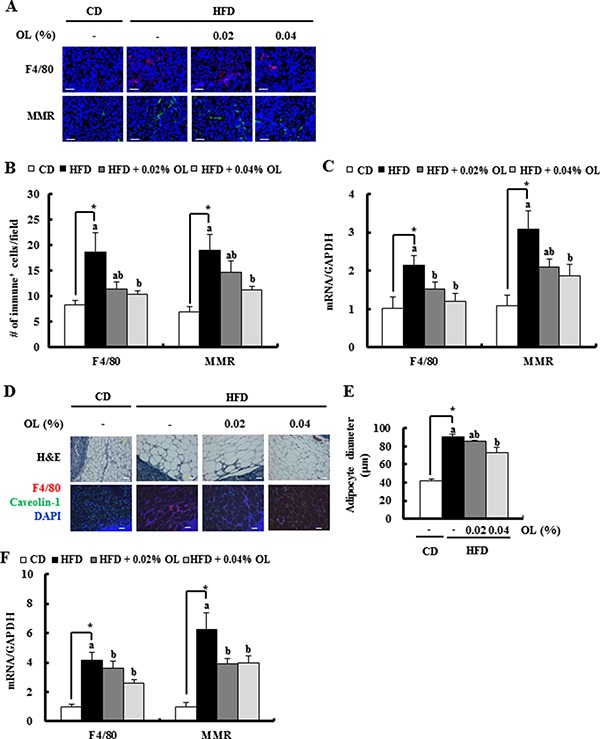
Figure 4. OL suppresses HFD-induced accumulation of M2-macrophages in the tumor tissues and adipose tissues surrounding the LNs.

(A, B) Tumor sections were stained with an antibody raised against F4/80 or MMR. (A) Representative immunofluorescence images are shown. (B) F4/80 and MMR-positive cells were quantified (n = 5). (C) Total RNA was isolated from tumor tissues, and F4/80 and MMR gene expression levels were determined using real-time RT-PCR (n = 9). (D, E) Sections of adipose tissues surrounding the LNs were stained with hematoxylin and eosin. Mature macrophages were identified using an F4/80 antibody (red) and adipocyte membranes a caveolin-1 antibody (green). Nuclei were counterstained with DAPI (blue). (D) Representative stained images are shown. (E) Mean diameters of adipocytes surrounding the LN were estimated (n = 4). (F) F4/80 and MMR gene expression levels in fat tissues surrounding the LN, as determined using real-time RT-PCR (n = 6). *Significantly different from the CD group, P < 0.05. Means without a common letter differ among the three HFD groups, P < 0.05.
