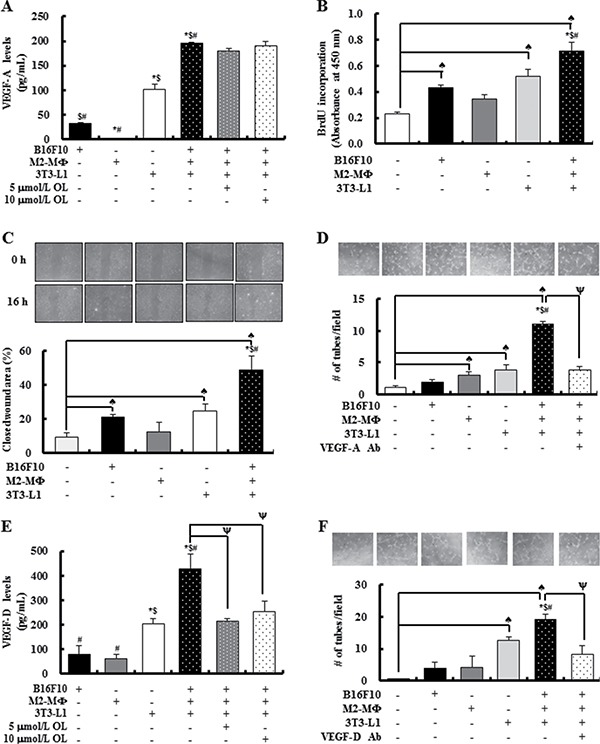
Figure 5. The cross-talk between tumor cells, M2-cells and adipocytes results in release of substantial amounts of VEGF-A and VEGF-D under hypoxic conditions stimulating angiogenesis and lymphangiogenesis, respectively.

B16F10s, M2-MΦs, and 3T3-L1 adipocytes were cultured separately or co-cultured under hypoxic conditions (1% O2, 5% CO2, and 94% N2) with or without OL treatment (0 - 10 μmol/L). (A) The concentrations of VEGF-A in conditioned media (CM) were estimated by using ELISA. Each bar represents the mean ± SEM (n = 4). (B) Cell proliferation was measured by using BrdU incorporation assay. HUVECs were treated for 6 h with CM collected under hypoxic conditions (hypoxic-CM). BrdU was then added, and the incubation was continued for a further 3 h to analyze BrdU incorporation into DNA (n = 3). (C) For wound-healing assay, HUVECs were plated and grown to 100% confluence; subsequently, an injury line was created using a yellow pipette tip and the cells were treated with hypoxic-CM for 16 h. (Upper panel) Wound closure was visualized under phase-contrast microscopy. (Lower panel) Quantification of wound closure (n = 3). (D) For tube formation assay, HUVECs were plated in Matrigel-coated plates. After 24 h, HUVECs were treated with hypoxic-CM in the absence or presence of an anti-VEGF-A antibody. (Upper panel) Tube formation was visualized under phase-contrast microscopy. (Lower panel) Quantification of HUVEC tube formation (n = 3). (E) VEGF-D concentrations in CM were estimated using ELISA (n = 4). (F) For tube formation assays, LECs were treated with hypoxic-CM in the absence or presence of an anti-VEGF-D antibody. (Upper panel) Tube formation was visualized under phase-contrast microscopy. (Lower panel) Quantification of LEC tube formation. Each bar represents the mean ± SEM (n = 3). ♠Significantly different from the DMEM group; *significantly different from the B16F10 group; $significantly different from the M2-MΦ group; #significantly different from the 3T3-L1 group; and ψsignificantly different from the B16F10/M2-MF/3T3-L1 co-culture group, P < 0.05.
