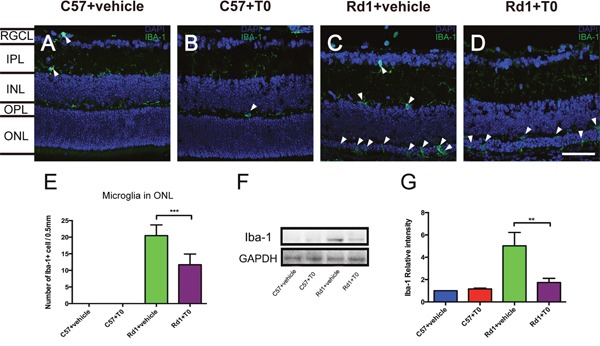
Figure 4. Effect of T0 on Iba-1-positive microglia cells in the retina of C57 mice and rd1 mice at P14.

(A-D) Representative images of Iba-1-positive cells in the retina of C57 and rd1 mice pretreated with T0 or vehicle. (E) Quantitative analysis of the number of Iba-1-positive cells in the ONL of each group. (F) Representative western blot of retina lysates from C57 and rd1 mice pretreated with T0 or vehicle. (G) The retina from rd1 mice shows significantly more IBA-1/GAPDH than that from C57 mice, while T0 treatment significantly reduces this level. RGCL, retinal ganglion cell layer; IPL, inner plexiform layer; INL, inner nuclear layer; OPL, outer plexiform layer; ONL, outer nuclear layer. Data are presented as the mean ± SEM. n=5 mice per group. ***P< 0.001, **P< 0.01. Scale bar in D=75 μm and applies to (A-D).
