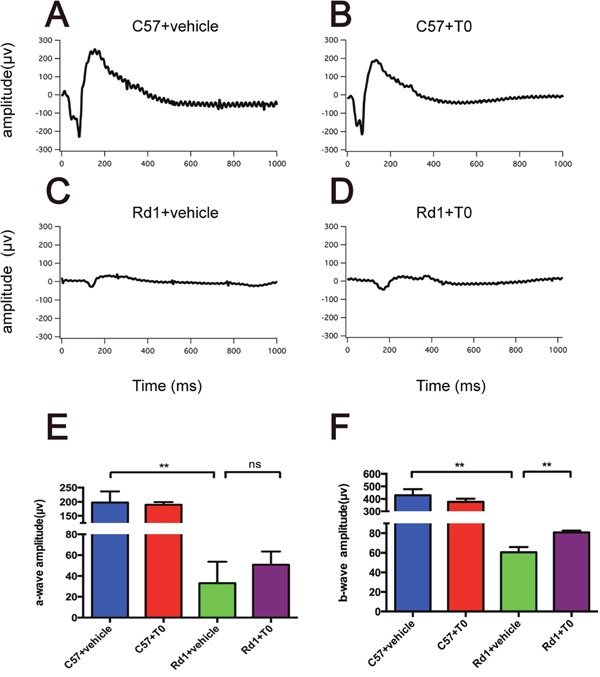
Figure 5. Electroretinogram test of the C57 and rd1 mice at P14 treated with T0.

(A-D) Representative raw ERG traces recorded from T0- or vehicle-treated C57/rd1 mice showing the definitions for the a- and b-waves. (E, F) Significant reduction of a- and b-wave amplitude of rd1 compared with C57 mice treated with vehicle. With T0 treatment, the b-wave of rd1 mice is significantly higher than that of control rd1 mice, while there is no difference in a–wave amplitude between them. n=5 mice per group. Data are presented as the mean ± SEM. n=5 mice per group **P<0.01.
