
Figure 5. Forest plots of subgroup analysis of the DFS/RFS.
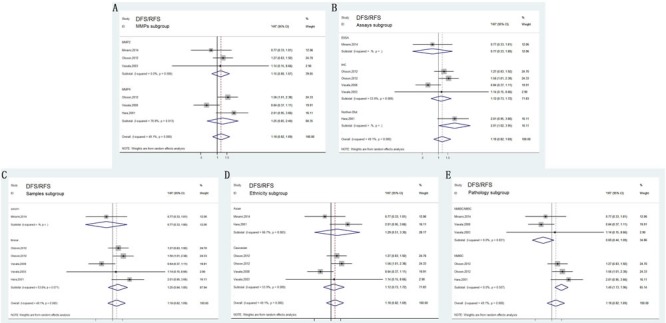
A. stratified by MMPs subgroups; B. stratified by Assay methods; C. stratified by Sample subgroups; D. stratified by Ethnicity subgroups; E. stratified by Pathology subgroups.
Official websites use .gov
A
.gov website belongs to an official
government organization in the United States.
Secure .gov websites use HTTPS
A lock (
) or https:// means you've safely
connected to the .gov website. Share sensitive
information only on official, secure websites.
A. stratified by MMPs subgroups; B. stratified by Assay methods; C. stratified by Sample subgroups; D. stratified by Ethnicity subgroups; E. stratified by Pathology subgroups.