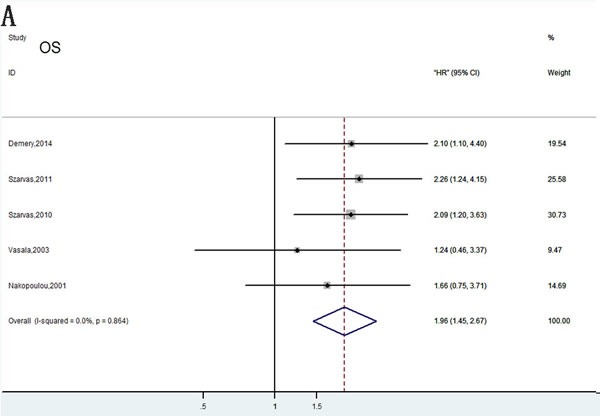
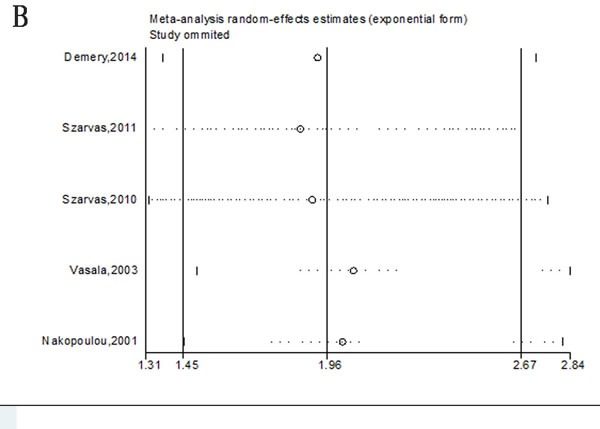
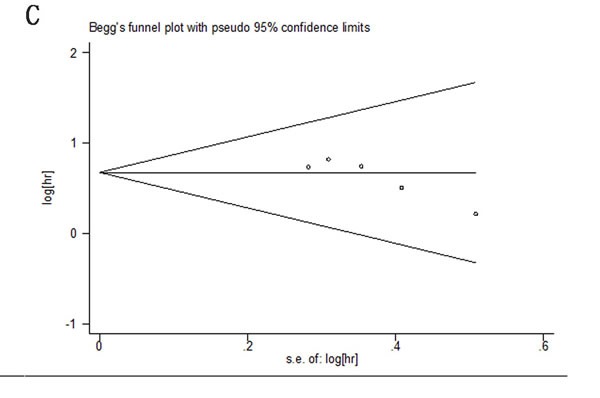
Figure 9. Meta-analysis of OS following exclusion of data from Vasala et al. (2008).


A. Forest plots analysis of OS; B. Sensitivity analysis to confirmation of results’ stability; C. Publication bias to the evaluation of studies’ symmetry.


A. Forest plots analysis of OS; B. Sensitivity analysis to confirmation of results’ stability; C. Publication bias to the evaluation of studies’ symmetry.