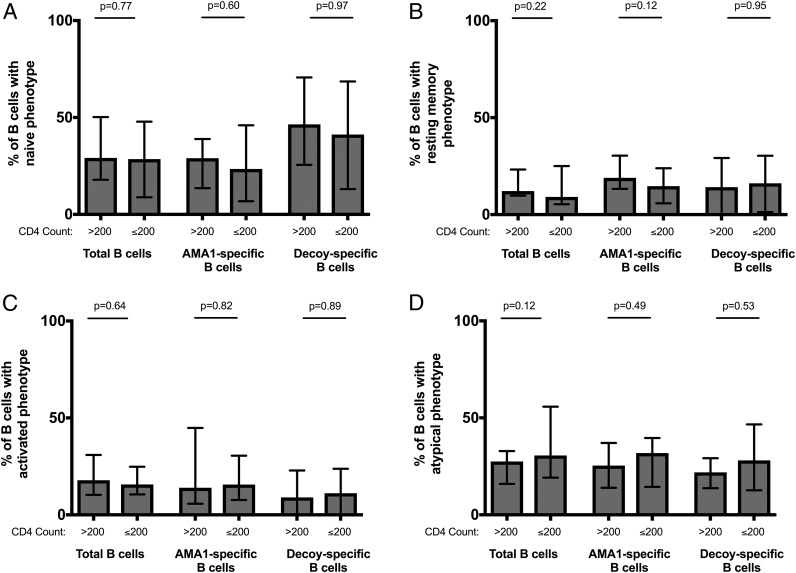
FIGURE 6.
Percentage of mature (CD19+ CD10−) B cells of each phenotypic subset in HIV-infected individuals with high (>200 cells per ml) and low (≤200 cells per ml) CD4 counts. (A) Naive, (B) resting memory, (C) activated, and (D) atypical phenotype. Each chart shows the distribution of these cells among mature B cells by their Ag specificity (total B cell pool, AMA1-specific B cells or decoy-specific B cells). Bars represent the median percentage and error bars show the interquartile range. Proportions of B cells between HIV-infected individuals with high and low CD4 counts were compared with Wilcoxon rank-sum testing.

