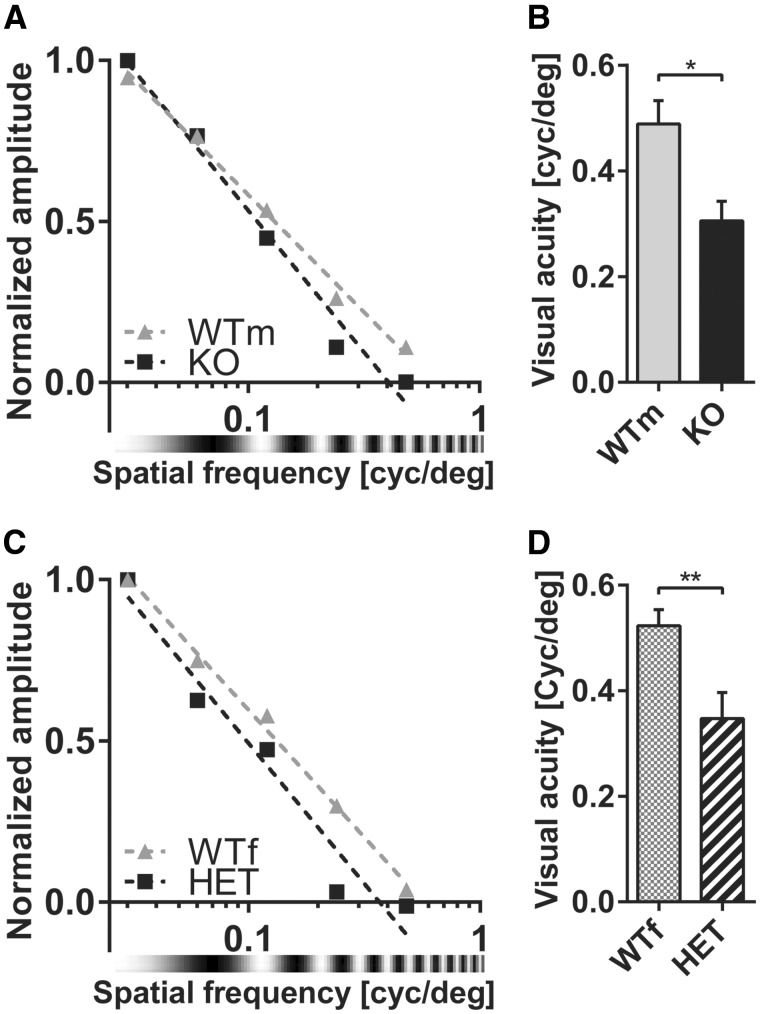
Figure 5.
(A) Spatial frequency response curve for contralateral eye stimulation in male wild-type (WTm) and cdkl5 null (KO) mice. Representative examples from single animals are reported. Data points are linearly fitted. (B) VEP visual acuity in WTm and KO mice. (C) Spatial frequency response curve for contralateral eye stimulation in female wt (WTf) and cdkl5 heterozygous (HET) mice. Representative examples from single animals are reported. Data points are linearly fitted. (D) VEP visual acuity in WTf and HET mice. In all panels, values are average±SEM. *P<0.05, **P<0.01.

