Figure 1.

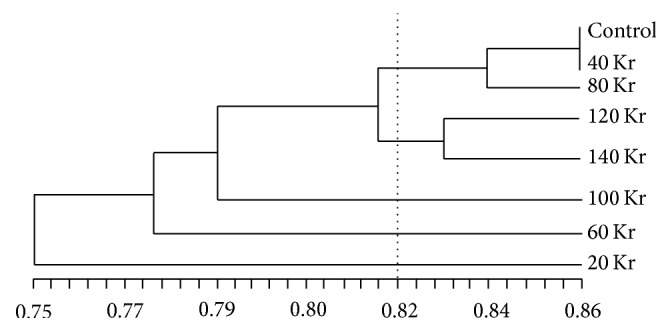
Dendrogram representing the morphological variation among seven irradiated mutants (20, 40, 60, 80, 100, 120, and 140 Kr) and the control based on similarity coefficients of ISSR data.

Dendrogram representing the morphological variation among seven irradiated mutants (20, 40, 60, 80, 100, 120, and 140 Kr) and the control based on similarity coefficients of ISSR data.