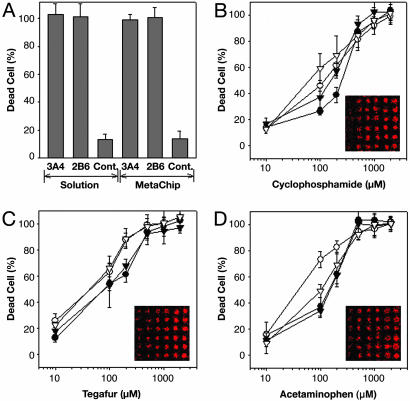
Fig. 4.
Comparison of cytotoxicity results for the MetaChip and solution-phase reactions. (A) Cytotoxicity of P450-activated CP (as represented by the percentage of dead cells) for solution and sol-gel incubations. Control incubations consisted of all system components, except for a P450 isoform. (B) Effect of CP concentration on the cytotoxicity of MCF7 breast cancer cells for: 3A4 solution (•), 3A4 sol-gel (○), 2B6 solution (▾), and 2B6 sol-gel (▿). (C) Effect of Tegafur concentration on the cytotoxicity of MCF7 breast cancer cells for: 1A2 solution (•), 1A2 sol-gel (○), 3A4 solution (▾), and 3A4 sol-gel (▿). (D) Effect of acetaminophen concentration on the cytotoxicity of MCF7 breast cancer cells for: 3A4 solution (•), 3A4 sol-gel (○), 2B6 solution (▾), and 2B6 sol-gel (▿). In B–D, images from the array scanner are presented. In each 6 × 6 array segment, the columns represent different concentrations of spotted compounds (from left to right: 10, 100, 200, 500, 1,000, and 2,000 μM), and the rows represent replicates.

