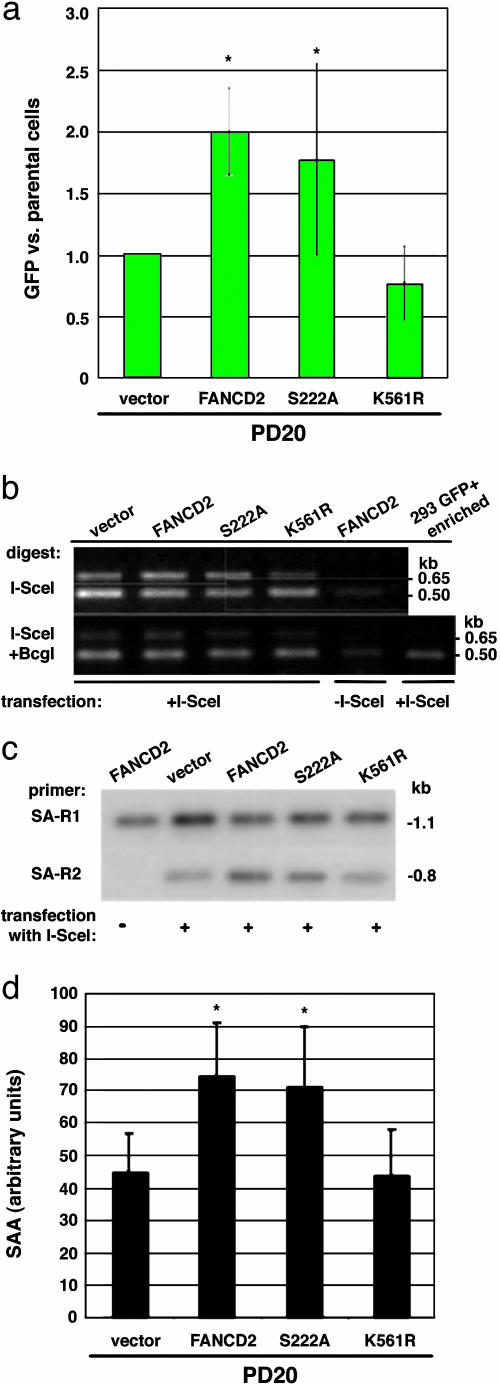
Fig. 4.
FA-D2 mutant cells have impaired homologous repair. (a) HDR in FA-D2 cells (PD20) expressing wild-type or mutant FANCD2 proteins. HDR is expressed relative to the mutant FA-D2 cells. Cells expressing wild-type FANCD2 or the ATM phosphorylation site mutant FANCD2-S222A have a higher level of HDR than cells expressing the monoubiquitination site mutant FANCD2-K561R or mutant (vector) cells. The difference between the mutant and FANCD2-complemented FA-D2 cells is statistically significant (asterisk, P = 0.0069), as is the difference between mutant and FANCD2-S222A-expressing cells (P = 0.046), using a paired t test. (b) FA-D2 cells have normal levels of chromosomal NHEJ. See Fig. 2a for a description of the primers. Note that the ratio of the 0.65-kb band to the 0.5-kb band after I-SceI/BcgI digestion is similar in intensity for each of the mutant or wild-type-complemented PD20 cells, indicating normal levels of NHEJ in the FA-D2 cells. (c and d) FA-D2 cells have reduced SSA. As with HDR, FA-D2 cells complemented with wild-type or FANCD2-S222A have higher levels of SSA than FANCD2-K561R-expressing or mutant FA-D2 cells. PCR products are derived from the strategy shown in Fig. 3a. As with the FA-A and FA-G cells, the difference in SSA levels is ≈2-fold between mutant and complemented FA-D2 cells. The difference between the mutant and FANCD2 or FANCD2-S222A complemented FA-D2 cells is statistically significant (P = 0.0076 and P = 0.0051, respectively).

