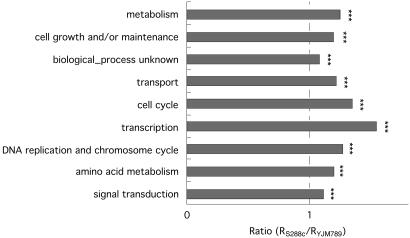
Fig. 2.
Relative increase of evolutionary rate in the laboratory strain for genes in different functional categories. The groups were ordered by decreasing number of genes in each category. The x-axis represents the ratio of evolutionary rate (R = KA/KS) in S288c to that in YJM789 (see Fig. 5 for the absolute increase in evolutionary rates in each functional category). ***, P < 0.001 by Student's t test for ratio >1. Genes in highly polymorphic regions between S288c and EM93 were excluded.

