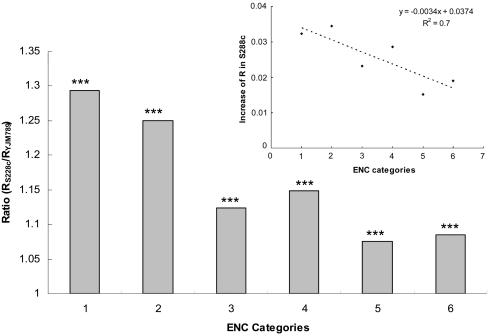
Fig. 3.
Increase of evolutionary rate in the laboratory strain for genes under different negative selection. The genes were divided into six categories basedon their ranked codon usage bias. Groups are in order of decreasing codon usage bias (increasing ENC). Each group has 559 genes (except group 6, which has 562 genes). (Inset) The absolute evolutionary rate increase in the laboratory strain. The dashed line represents the linear regression line. Grouping genes based on the average codon usage between S288c and YJM789 gave similar results (data not shown). ***, P < 0.001 by Student's t test for ratio >1. Genes in highly polymorphic regions between S288c and EM93 were excluded.

