
Figure 1.
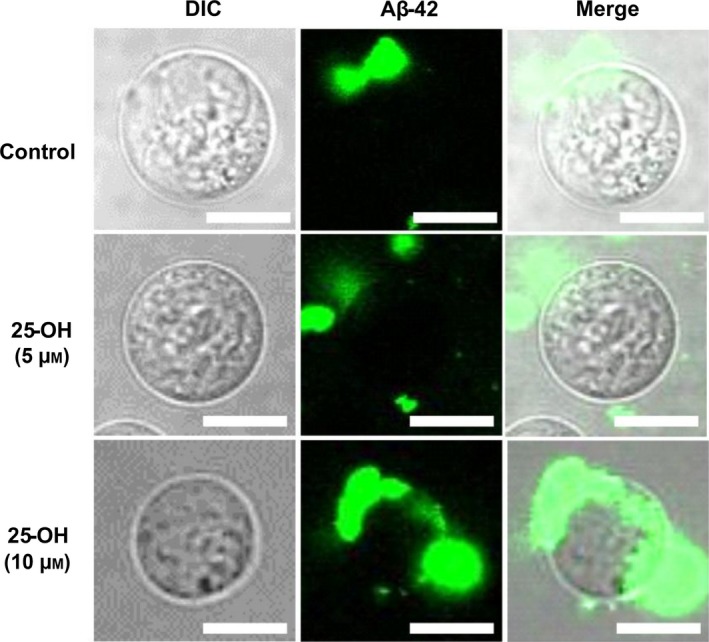
Addition of 25‐OH and exposure to protofibrillar Aβ‐42. Representative microscopic images of Jurkat T cells both control (basal level cholesterol) and with added 25‐OH (5 and 10 μm) after exposure to protofibrillar Aβ‐42. Gray image is DIC microscopic image of the cell, green fluorescence represents HiLyte Fluor‐labeled Aβ‐42 (488 nm) taken by confocal laser scanning microscopy and merged images show overlapping of the two forms. Images of one representative experiment out of three performed. Number of cells observed were 150–200. Scale bars = 10 μm.