
Figure 2.
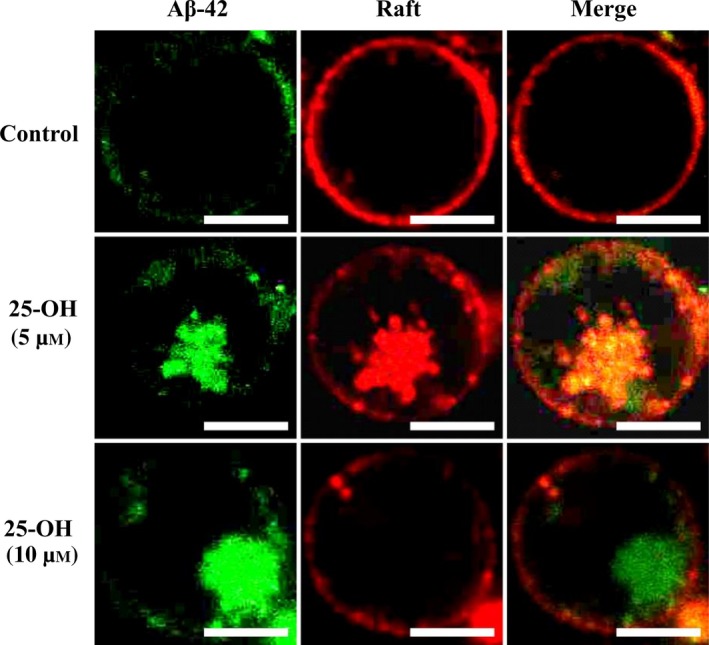
Role of CT‐B and 25‐OH in intracellular transport of protofibrillar Aβ‐42. Representative confocal microscopic images of Jurkat T cells both control and with added 25‐OH (5 and 10 μm). Green and red fluorescence represent HiLyte Fluor‐labeled Aβ‐42 (488 nm) and CT‐B (555 nm), respectively. Images of one representative experiment out of three performed. Number of cells observed were 150–200. Scale bars = 10 μm.