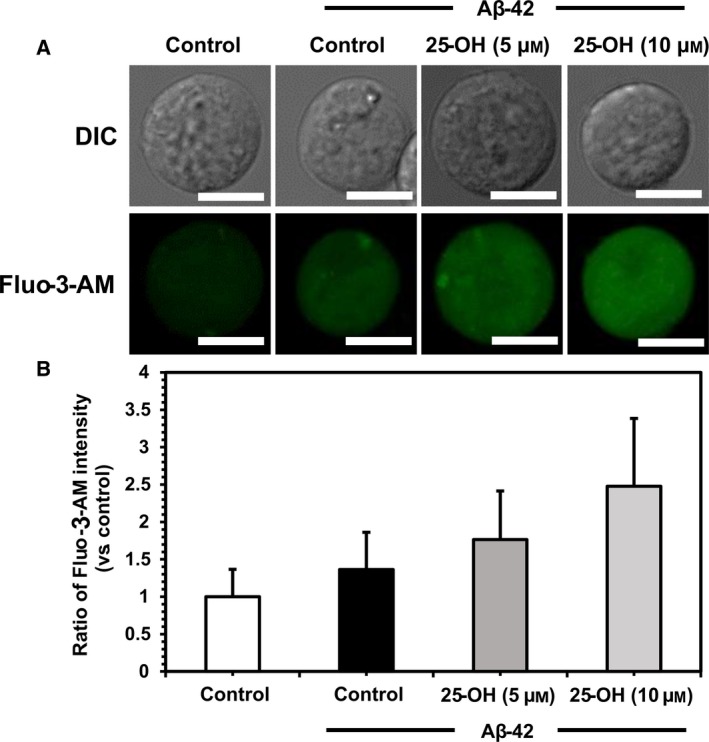
Figure 5.

Changes in intracellular calcium level. (A) Microscopic images of both control and with added 25‐OH cells with and without exposure to protofibrillar Aβ‐42 for 1 h and subsequently loaded with Fluo‐3‐AM to measure the release of calcium. Upper and lower images were taken by DIC microscopy and confocal laser scanning microscopy, respectively. Green fluorescent represents Fluo‐3‐AM (488 nm). (B) Graphical representation of the effects of 25‐OH (5 and 10 μm) on intracellular calcium release represented by the fluorescent intensity of Fluo‐3‐AM based on that for cell without Aβ‐42 and 25‐OH. Images of one representative experiment out of three performed. Values are given as means ± SD of three independently performed experiments. Number of cells observed were 150–200. Scale bars = 10 μm.
