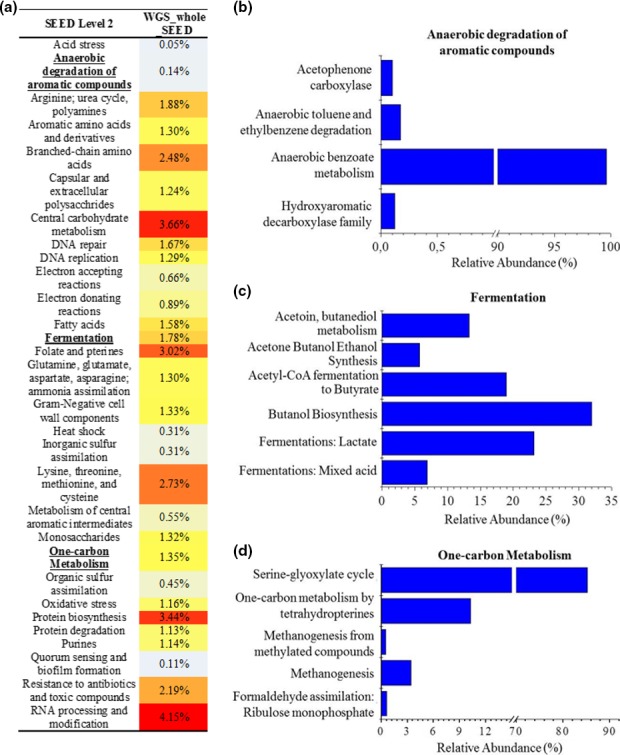
Figure 4.

WGS_whole dataset annotated by SEED subsystems database through MG‐RAST server. (a) Heat map of relative abundances of major level 2 SEED (gray for underestimated and red for overestimated abundance). (b – d) Bar plots of level 3 SEED derived from level 2 of anaerobic degradation of aromatic compounds (b), fermentation (c), and one‐carbon metabolism (d) with normalized data
