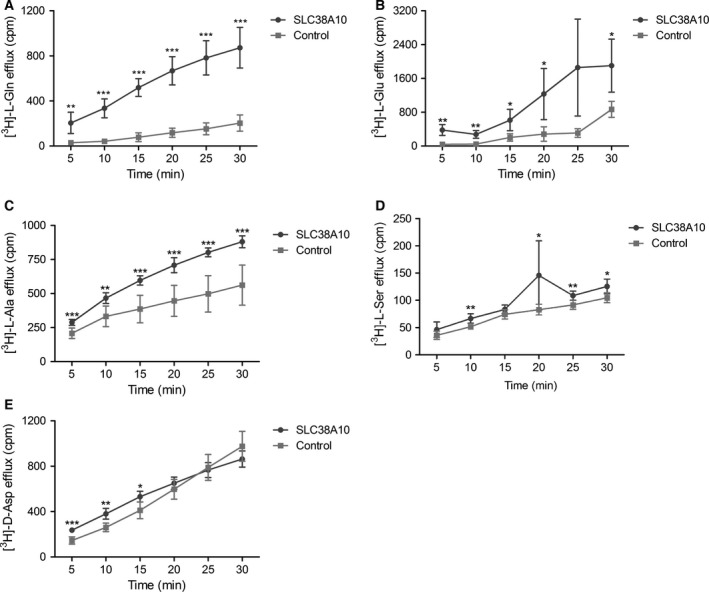
Figure 7.

Transport data from radiolabeled efflux assays. The SLC38A10 oocytes and control oocytes were injected with 23 nL of radiolabeled amino acid and the efflux was measured in 100 μL of transport buffer every 5 min for 30 min in count per minute (cpm) using scintillation counting. Unpaired t‐test with 95% confidence interval was performed, (*P < 0.05, **P < 0.01, ***P < 0.001), (n = number of SLC38A10 overexpressing oocytes; number of control oocytes), (A) l‐glutamine efflux assay at pH 7.8, (measured efflux ±SD), n = 6;6, [(5 min, P = 0.0011), (10 min, P < 0.0001), (15 min, P < 0.0001), (20 min, P < 0.0001), (25 min P < 0.0001), (30 min, P < 0.0001)]. (B) l‐glutamate efflux assay at pH 7.8, (measured efflux ±SD), n = 4;4, [(5 min, P = 0.0049), (10 min, P = 0.004), (15 min, P = 0.0372), (20 min, P = 0.0398), (25 min P = 0.0584), (30 min, P = 0.0340)]. (C) l‐alanine efflux assay at pH 7.4, (measured efflux ±SD), n = 7;7, [(5 min, P = 0.0004), (10 min, P = 0.0014), (15 min, P = 0.0002), (20 min, P = 0.0001), (25 min P < 0.0001), (30 min, P = 0.0001)], (D) l‐serine efflux assay at pH 7.8, (measured efflux ±SD), [(5 min, n = 6;6, P = 0.1472), (10 min, n = 5;5, P = 0.0054), (15 min, n = 5;6, P = 0.1017), (20 min, n = 6;6, P = 0.0369), (25 min, n = 5;6, P = 0.00074), (30 min, n = 5;6, P = 0.0140)], (E) d‐aspartate efflux assay at pH 7.8. (measured efflux ±SD), n = 5 for both groups and times except n = 6 for controls at 5 and 10 min [(5 min, P = 0.0003), (10 min, P = 0.0011), (15 min, P = 0.0160), (20 min, P = 0.2821), (25 min P = 0.7074), (30 min, P = 0.1307)].
