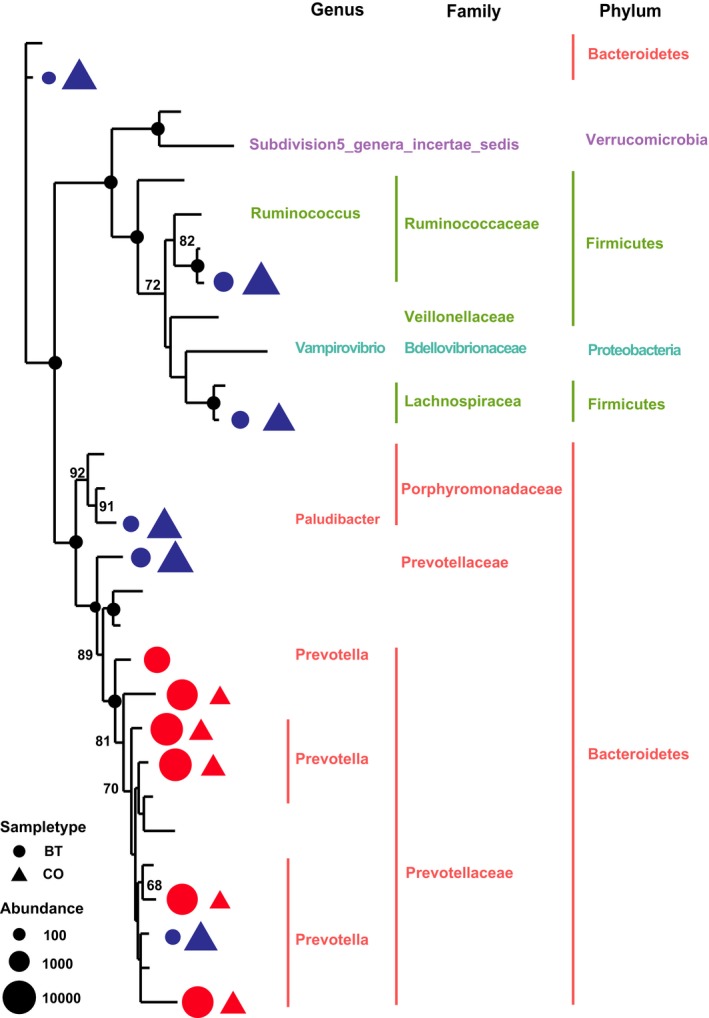
Figure 2.

Maximum likelihood tree of the detectable OTUs (relative abundance > 1% for a given sample). The complete 16S rRNA gene sequence of the corresponding species in RDP database were used to construct the tree. Triangle indicates the OTUs in CO group, and the circle indicates the OTUs in BT group. Only the OTUs with significant differences (p < .05) in relative abundance are shown behind the branch. The size of the symbol indicates the relative abundance of OTUs. The red indicates a significant expansion (p < .05) on the relative abundance of the OTU after butyrate infusion, and the blue indicates a significant reduction (p < .05) on the relative abundance of the OTU after butyrate infusion. The bootstrap values, which are more than 60 in the ML analysis, are shown on the tree. The solid black circles on the nodes stand for the bootstrap value of 100
