Figure 4.

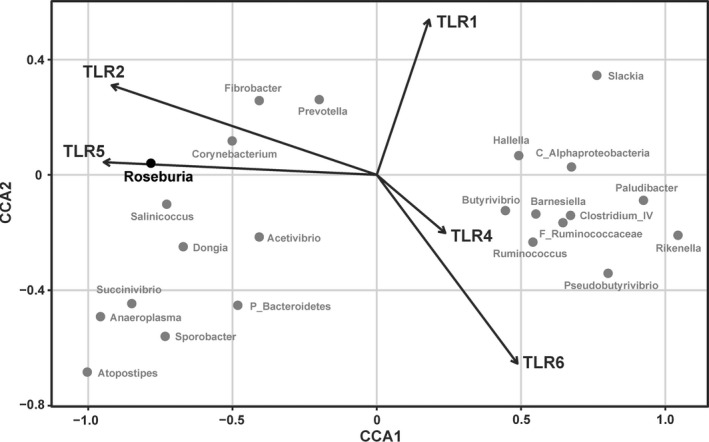
Constrained correspondence analysis revealed the correlations between the abundance of the microbial biomarkers and the expression of the significantly changed TLRs (p < .05 in t test)

Constrained correspondence analysis revealed the correlations between the abundance of the microbial biomarkers and the expression of the significantly changed TLRs (p < .05 in t test)