Figure 5.
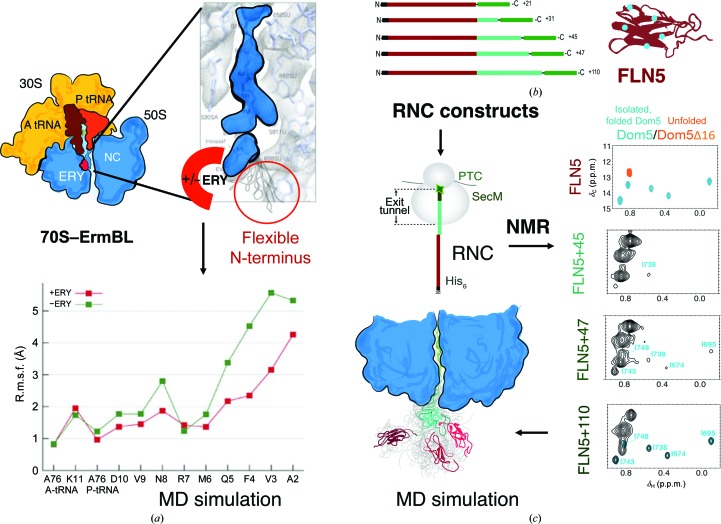
Complementary structural methods to study dynamic biological systems. (a) Diagram of the cryo-EM map of the ErmBL stalled NC structure bound to A-tRNA (brown), P-tRNA (dark orange) and erythromycin (ERY, red), as shown in the enlarged panel. In this panel, the ErmBL NC (blue) flexible N-terminus is located (circled in red) near to the ERY binding pocket (red). This region was modelled in using the N-terminal peptide sequence of ErmBL with and without the ERY molecule in an all-atom MD simulation. The graph from the MD simulation (bottom panel) shows the calculated root-mean-squared fluctuations (r.m.s.f.s) in the N-terminal residues (x axis) with (red) and without (green) the ERY antibiotic molecule (adopted from Arenz et al., 2016 ▸). (b) The schematic panel describes how co-translational folding of an Ig domain was studied using biochemical construct design, NMR spectroscopy and MD simulation. FLN5 RNCs (brown) were labelled at specific Ile residues (blue) with 13C and the RNC constructs had multiple linker lengths. The FLN6 (cyan) linkers were varied in their lengths while the FLN5 (also known as Dom5, brown) and SecM (green) peptide sequences were kept the same. This enabled tethering FLN5 (brown) on the ribosome and ‘structural snapshots’ of FLN5 emerging and folding on the ribosome to be taken by NMR spectroscopy. (c) Each13C–1H two-dimensional NMR spectrum shows the chemical shifts for the labelled Ile residues on FLN5 RNCs; the first spectrum in the top left panel shows an overlay of isolated and folded FLN5 (cyan peaks) and an unfolded variant (Δ16; orange peaks). This spectrum was used as a reference to map Ile residues for FLN5 RNCs at different linker lengths (two-dimensional spectra for FLN5+45, FLN5+47 and FLN5+110 below). An ensemble of FLN5 NC structures was reported using NMR spectroscopy and MD simulation (adopted from Cabrita et al., 2016 ▸).

