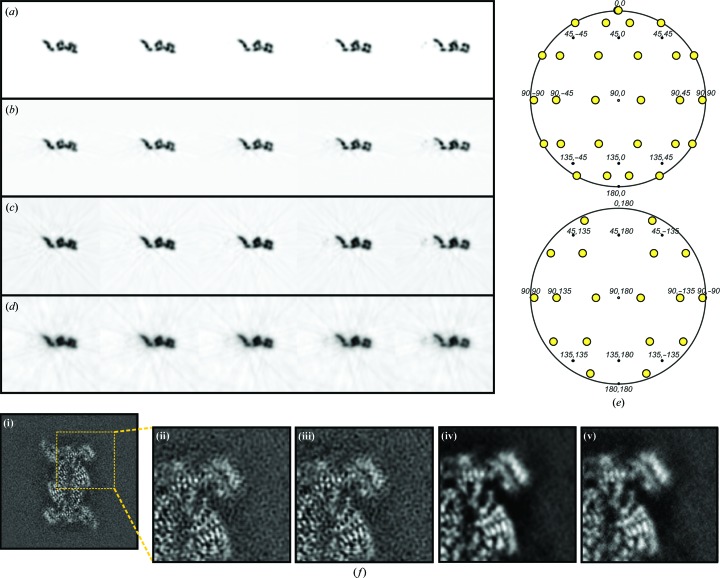
Figure 3.
Effect of the different parameters used in icr3d reconstructions. (a–e) Tests with the model density illustrated in Fig. 2 ▸(c). (a) Sections of model density. (b, c, d) Sections from reconstructed density produced from input projection images sampled at 30° intervals. (b) Sections from reconstruction with the contribution envelope set to match the dimensions of the reconstructed object as illustrated in Fig. 2 ▸(c) (i.e. the standard mode of usage for icr3d). (c) Sections from reconstruction with the contribution envelope set to match the dimensions of the reconstructed volume. (d) Sections from reconstruction calculated with the contribution envelope set to match the dimensions of a reconstructed volume of twice the size used in (c). (e) Distribution of Euler angles of the input projection images with 30° sampling, used to calculate the maps in (b–d). (f) Reconstruction of the human 20S proteasome from cryo-EM data (da Fonseca & Morris, 2015 ▸) illustrating the effect of different parameters on a single section of reconstructed density. (i) Reconstruction using CTF weighting, CTF amplitude correction and set to match the dimensions of the 20S proteasome; (ii) magnified region of image (i); (iii) as (ii) but with the contribution envelope set to match the reconstructed volume; (iv) as (ii) but with no CTF amplitude correction; (v) as (iv) but with no CTF weighting.

