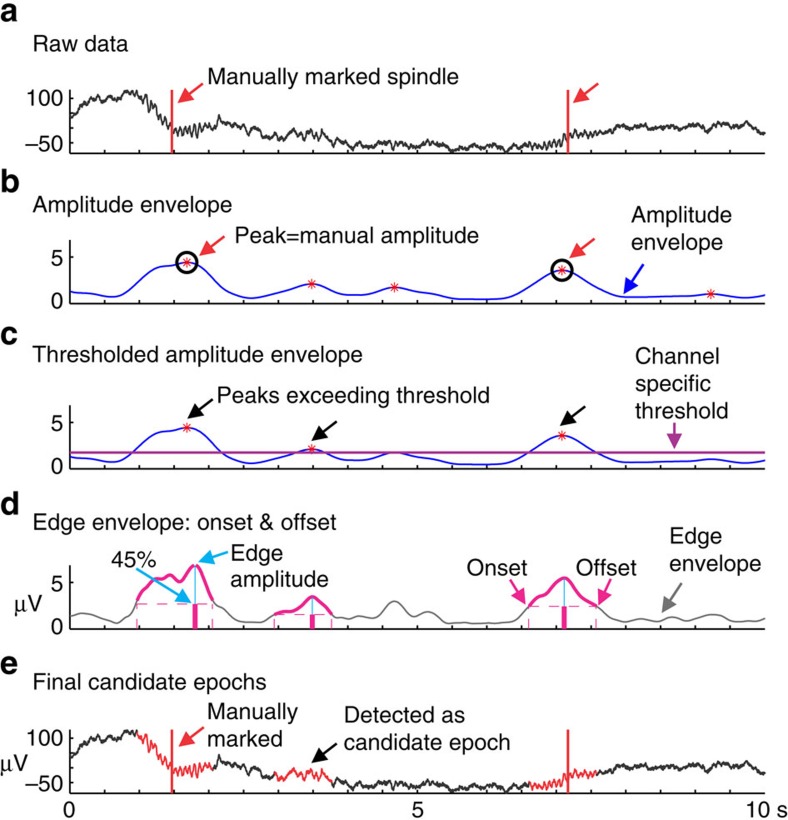
Figure 7. Selection of candidate epochs by current spindle detection method.
(a) Spindles are manually marked (red lines) on 10 min of N2 and 10 min of N3 raw data, per channel. (b) The amplitude of peaks in the amplitude envelope corresponding to manually marked spindles are calculated (manual amplitude, black circles). (c) A per channel threshold (purple line) is applied to the amplitude envelope based on the lowest manual amplitude for that channel. Peaks, marked by red asterisks, which exceed that threshold are kept as candidate epochs. (d) The closest peak in the edge envelope to the selected peak in the amplitude envelope is detected as the edge amplitude (blue vertical lines). The bounds of the onset and offset of the spindle (pink traces) are calculated at 45% or greater of this edge amplitude. (e) The final candidate epochs highlighted in red include epochs where spindles had (red lines) and had not (black arrow) been manually marked.

