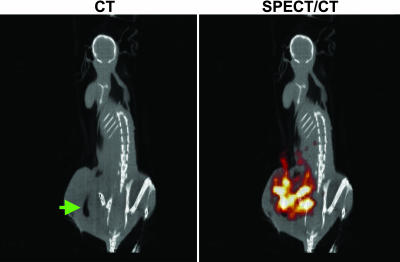
Fig. 6.
SPECT/CT of a tumor after bacteriolytic therapy. A BALB/c mouse harboring a CT-26 mouse tumor was treated with C. novyi-NT and injected with [125I]FIAU, as described in Fig. 5. The animal was scanned by using SPECT with CT coregistration 24 h after injection of [125I]FIAU. The green arrow indicates gas within the tumor caused by the infection, and the red/orange signal represents [125I]FIAU uptake by C. novyi-NT within the tumor.

