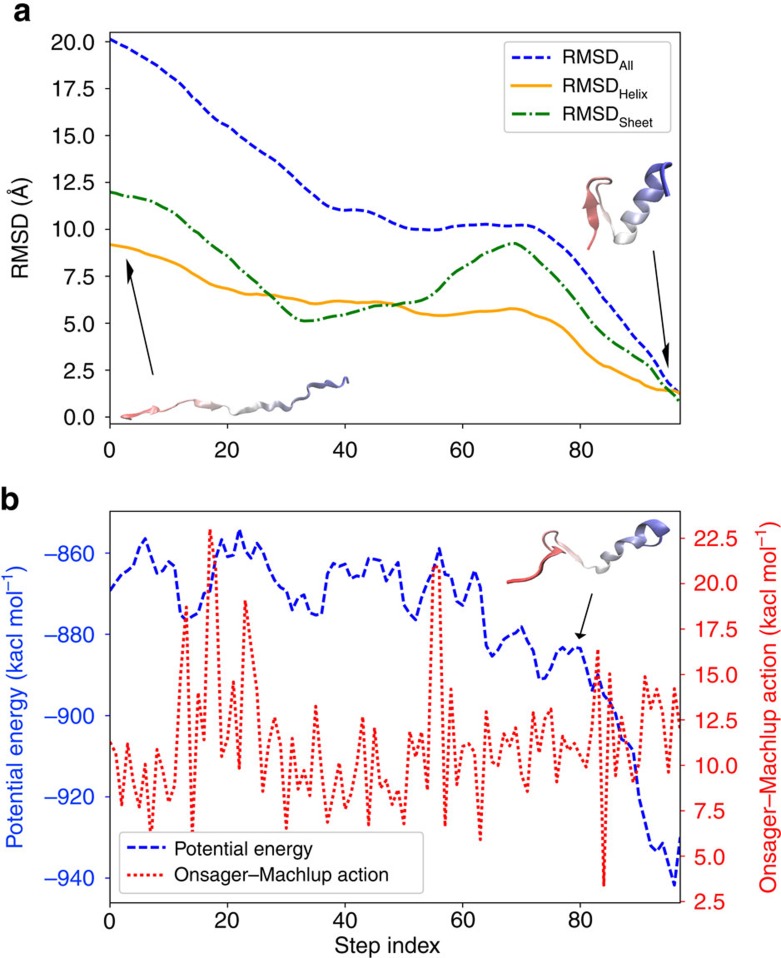
Figure 3. The lowest action folding pathway of FSD-1.
(a) The root mean square deviation values of the entire FSD-1 (blue), the C-terminal α-helix (green, residue 14–28), and the N-terminal β-hairpin (orange, residue 1–13) from the native structure along the folding pathway are displayed. (b) The evolutions of potential energy (blue) and the Onsager–Machlup action (red) of FSD-1 along the folding pathway are displayed.

