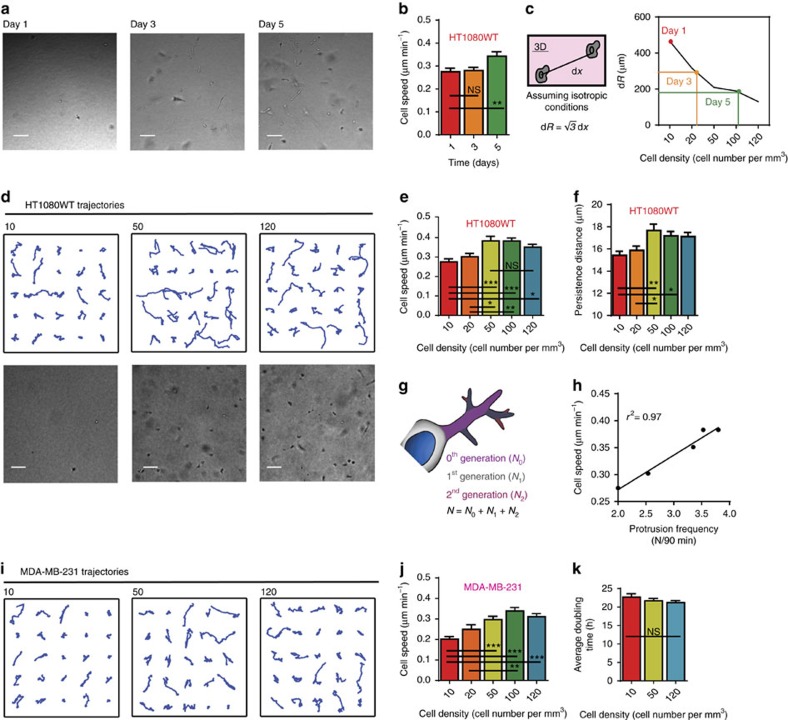
Figure 1. Effect of cell density on cancer cell motility.
(a) Phase contrast micrographs demonstrate confluence of human fibrosarcoma cells (HT1080WT) days after initial seeding. Scale bar, 100 μm. (b) Cell speed measured at a time lag of 2 min days after initial seeding. (c) Average distance to nearest cell (dR) relates density at different days to initial seeding density. (d) Randomly selected trajectories of human fibrosarcoma cells (HT1080WT) under different seeding densities of 10, 50, 120 cells mm−3 embedded in a 3D collagen matrix. Phase contrast micrographs demonstrate the confluence at each density. Scale bar, 100 μm. (e,f) Cell speed and persistence distance measured at a time lag of 2 min at different seeding densities. (g) Topology of protrusions for cells embedded in 3D collagen matrices: 0th generation protrusions (N0) originate from the cell body, 1st generation protrusions (N1) stem from N0 and 2nd generation protrusions (N2) stem from N1. (h) Cell speed and protrusion frequency are highly correlated. (i) Randomly selected trajectories of human carcinoma breast cancer cells (MDA-MB-231) under seeding densities of 10, 50, 120 cells mm−3. (j) Cell speed evaluated at a time lag of 2 min, at five different seeding densities. Cells at high seeding densities (ρ>50) show a significantly higher speed than cells seeded at low seeding density (ρ=10). (k) Average doubling time at increasing cell density demonstrates that proliferation is independent of cell density. In all panels, data is represented as mean±s.e.m. from three independent experiments. *P<0.05; **P<0.01; ***P<0.001 (ANOVA) (n=3).

