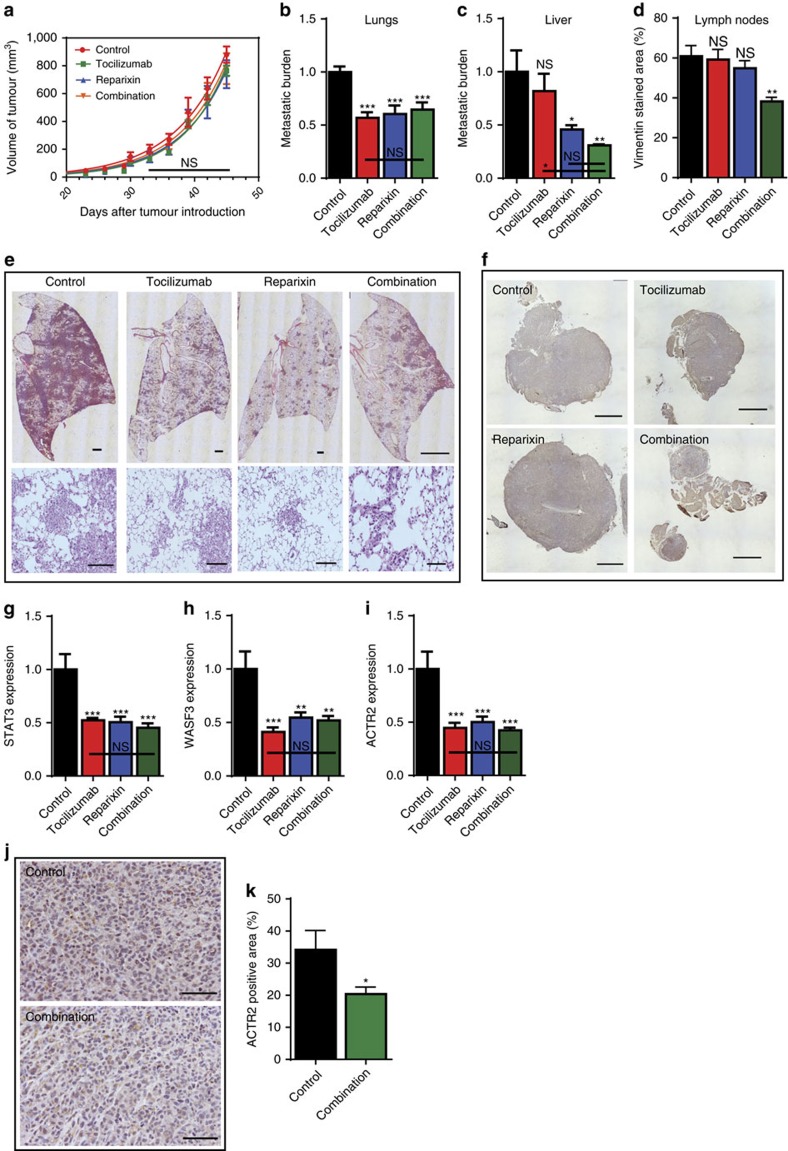
Figure 5. In vivo validation.
(a) Tumour volume measured over time. (b,c) Human genomic DNA content in mouse lungs and livers were quantified using qPCR to determine the metastatic burden. (d) Vimentin staining of lymph nodes quantified by image analysis. (e) Images of mice lungs that were stained with hematoxylin and eosin. Scale bar, 100 μm. (f) Images of lymph nodes that were stained with vimentin. Scale bar, 100 μm. (g–i) Decreased expression of STAT3, WASF3 and Arp2/3 in treated group compared with the control group. (j) Immunohistochemical staining of primary tumour sections for Arp2/3. Scale bar, 100 μm. (k) Arp 2/3 staining of primary tumour sections quantified by image analysis. In all panels, data is represented as mean±s.e.m. of five mice. *P<0.05; **P<0.01; ***P<0.001 (ANOVA).

