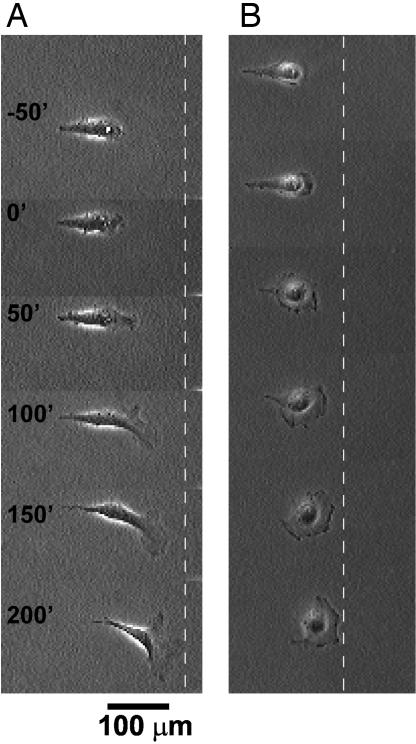
Fig. 3.
Time-lapse images (in minutes) show the motility of an initially polarized 3T3 fibroblast after its constraint is released. (A) We applied the voltage pulse at time t = 0. The dotted line serves as a reference for the location of the cell. (B) Another type of cell, COS-7, shows similar behavior.

