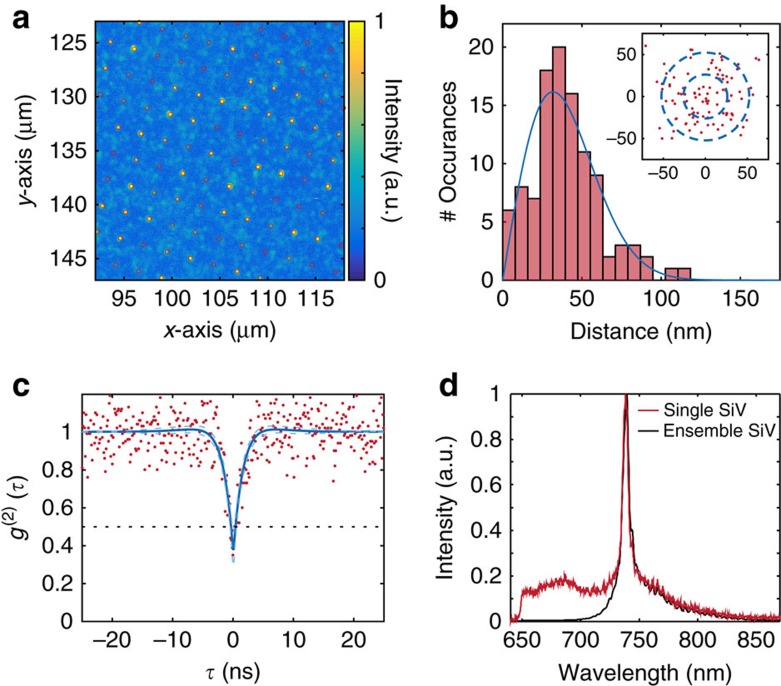
Figure 2. Spatial precision of SiV creation.
(a) Confocal scan of SiV centre array. Sites are separated by 2.14 μm. Overlaid are regular grid points from an aberration-corrected reference lattice. (b) Analysis of implantation precision. We determine the 2D position uncertainty of the created SiV be 40±20 nm. Blue curve: fit to Rayleigh distribution. Inset: Scatter plot of created single SiV sites relative to their grid points with one and two σ guides to the eye, where the radius σ=26 nm corresponds to the expected implantation s.d. resulting from the combination of beam width and implant straggle. (c) Normalized second-order autocorrelation function of a single SiV with g(2)(0)=0.38±0.09. Red points indicate data (without background subtraction), and the blue line is a fit to the function 1−A·exp(−|τ/t1|)+B·exp(−|τ/t2|). The black dashed line indicates g(2)(τ)=0.5, while the blue dashed lines indicate the 95% confidence interval on the fit. (d) Ensemble (black) and single-emitter (red) SiV room temperature fluorescence spectra. The characteristic zero-phonon line at 737 nm is prominent.

