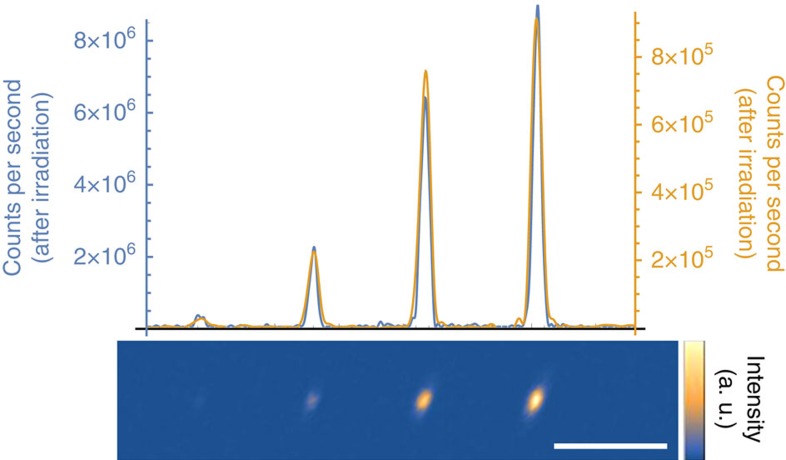
Figure 4. Electron co-implantation.
After electron irradiation and subsequent annealing we observe a 10-fold increase in fluorescence intensity at the implantation positions of Si ions (lower inset). The Si ion doses were 500, 2,000, 5,000 and 10,000 ions per spot. The yellow line plot through the fluorescence maximum of the image indicates the intensity before electron irradiation, and the blue line after irradiation. Scale bar, 5 μm.

