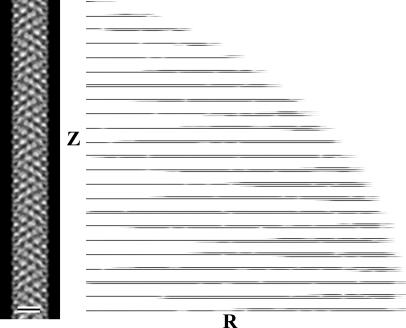
Fig. 1.
EM and image analysis of the hook. The average of all of the hook data sets seen as a projection of the three-dimensional map is shown in Left. Such a projection is equivalent to the average hook image as it would be seen in the electron microscope. (Scale bar: 10 nm.) A display of the layer-line data [Gn(R, Z)] for the data included in the average is shown in Right. The logarithm of the amplitude is displayed to make the weaker layer lines visible. The cutoff in resolution is 0.9 nm.

